Security Gap Visualization
See how CimTrak helps organizations strengthen security with real-time monitoring, change detection, and continuous visibility across critical systems. Take the threat simulation to evaluate your security readiness and discover opportunities to improve threat detection and response.
Start the threat simulation today. Contact Gravity Computers Inc. to learn how CimTrak can help you build a stronger, more resilient security strategy.
What is security gap visualization?
Security gap visualization is a way of visually mapping where your security controls fall short against the risks and assets you need to protect. Instead of only listing alerts, logs, or compliance checks, it focuses on showing:
- Which areas are covered by existing security tools and processes
- Where gaps exist—for example, unmonitored systems, missing controls, or weak configurations
- How severe each gap is in the context of your environment
Traditional dashboards often present raw metrics (number of alerts, patch status, tool uptime). Security gap visualization reimagines this by connecting those data points into a clear picture of risk coverage vs. exposure, so teams can see at a glance where they are protected and where they are not.
Why does visualizing security gaps matter?
Visualizing security gaps helps teams move from reacting to alerts to proactively managing risk. When gaps are clearly mapped, you can:
- Prioritize remediation by focusing on the most exposed assets or highest-impact gaps first
- Align security investments with actual coverage needs instead of buying overlapping tools
- Communicate with leadership using visuals that make risk and progress easier to understand
For example, instead of saying “we have open vulnerabilities,” you can show that specific business-critical systems lack endpoint protection or network monitoring. That kind of visualization supports better decisions on budget, staffing, and timelines.
Who benefits from security gap visualization?
Security gap visualization is useful for several groups across the organization:
- Security and IT teams use it to see where controls are missing or misconfigured, plan remediation work, and track progress over time.
- Risk and compliance teams use it to connect technical gaps to policy or regulatory requirements, making it easier to show how controls map to frameworks.
- Executives and business leaders use high-level views to understand where the organization is exposed and how security initiatives are reducing that exposure.
In practice, this means moving from scattered reports to a shared visual view of coverage and gaps, helping everyone make more informed, coordinated decisions about security priorities.
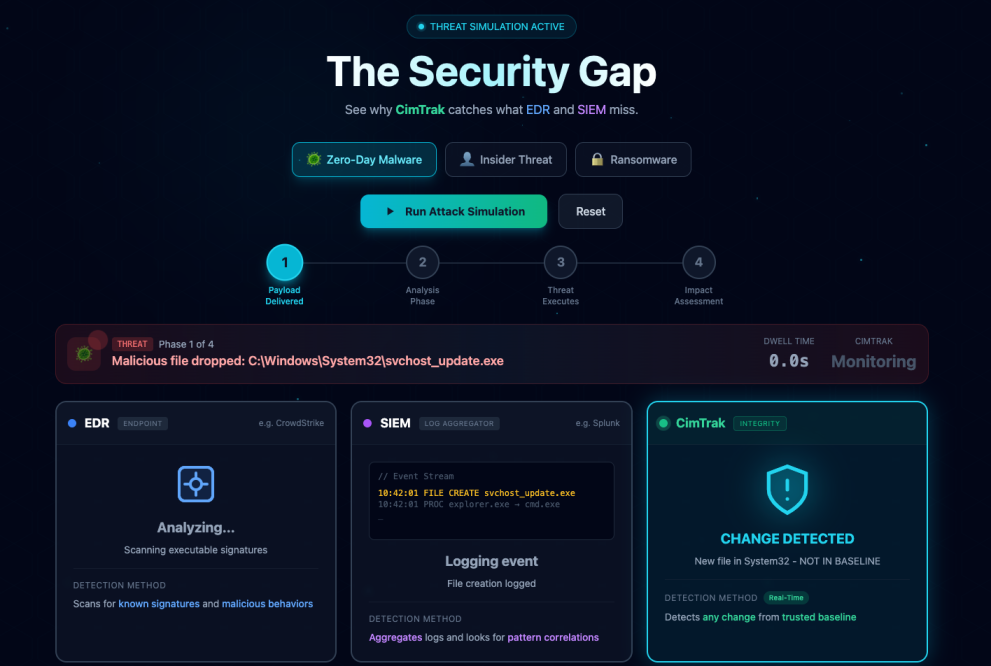
Security Gap Visualization
published by Gravity Computers Inc.
We LOVE what we do and we'll help your business find IT success. We'll get your computers, network, and servers in shape and keep your staff happy.
We go the distance to build technology solutions for your business.
Gravity Computers is an award winning IT Service company. Our past awards and achievements include Consumer Choice Award (in two consecutive years), BIV Fastest Growing Companies (2 years), A+ Rating with the BBB, and lots of Microsoft certifications along our 17 year history. We are Canadian and provide service throughout North America with the majority of our clients in Vancouver, BC, and the Lower Mainland.
Our boutique-like service supports Small and Medium Businesses from 1 to 150 users with the majority of our clients in the the middle range. We help with all aspects of IT from planning, deployment, programming, web development, server management, desktop helpdesk support and more.



 Sign in with LinkedIn